Stirewalt on 'silver lining' for GOP following Moore defeat
Democrat Doug Jones defeats Republican Roy Moore in tight race for Alabama Senate.
Doug Jones became the first Democratic Senator from Alabama in two decades in a stunning result that brings the Republican majority down to just a single seat. Jones’s victory marked the end of a highly unusual special election to fill the seat vacated by Attorney General Jeff Sessions.
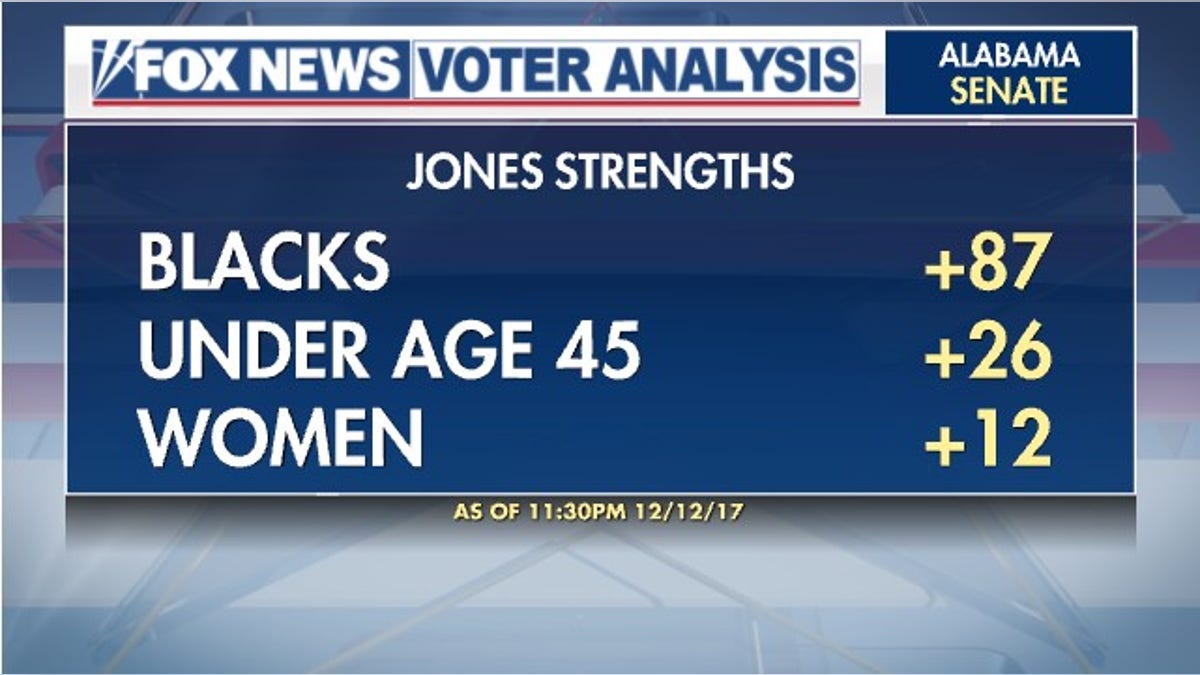
Jones carried the day by rolling up strong margins among blacks (93-6 percent), younger voters (62-36 percent), and women (55-43 percent).

Men went for Moore by 10 points (54-44 percent). His greatest areas of strength were working class whites (32-67 percent for a 35-point margin), white men (33-65 percent and a 32-point margin), and white evangelicals (21-77 percent, 56-point margin).
FOX NEWS VOTER ANALYSIS FINAL RESULTS
While Moore won among white women by 22 points (38-60 percent), that is a sizable drop from the 83 percent of white women that voted for Mitt Romney in 2012, the last time there was an exit poll in Alabama.

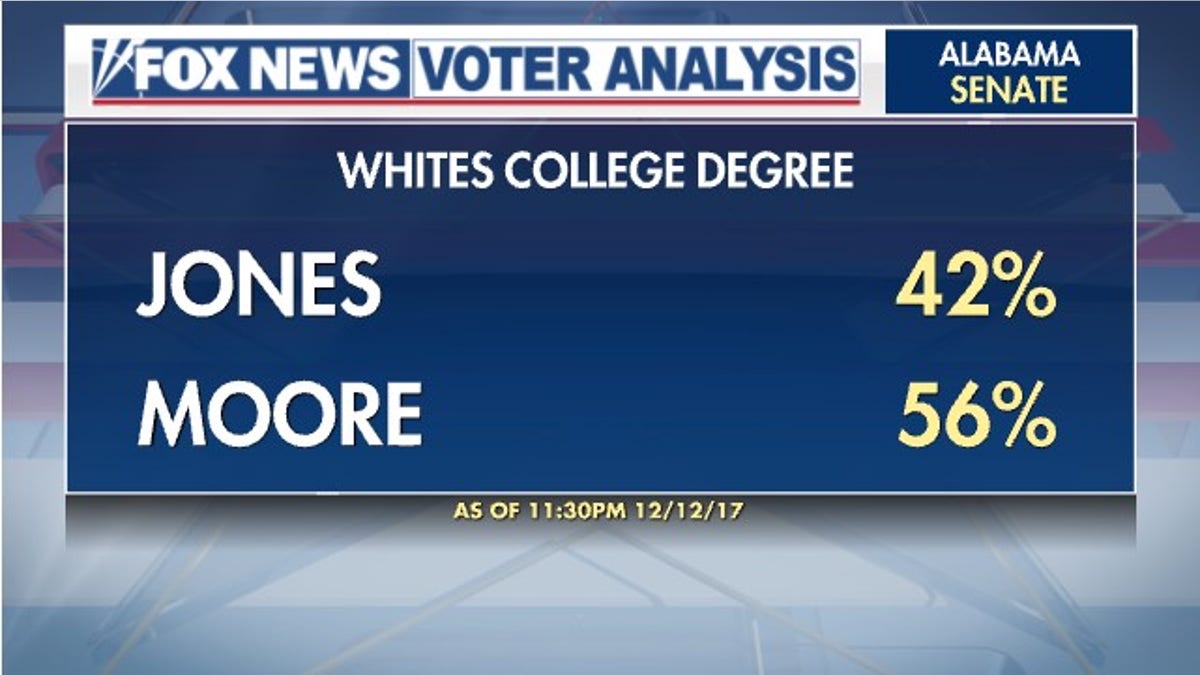
Jones was also able to keep the race somewhat close among college-educated whites, who went for Moore by 14 points, 56-42 percent.
Allegations of sexual misconduct against Moore emerged on November 9, when it was reported that he had engaged in inappropriate relations with teenage girls while in his thirties. Moore denied the allegations throughout the campaign, and called into question the credibility of his accusers.

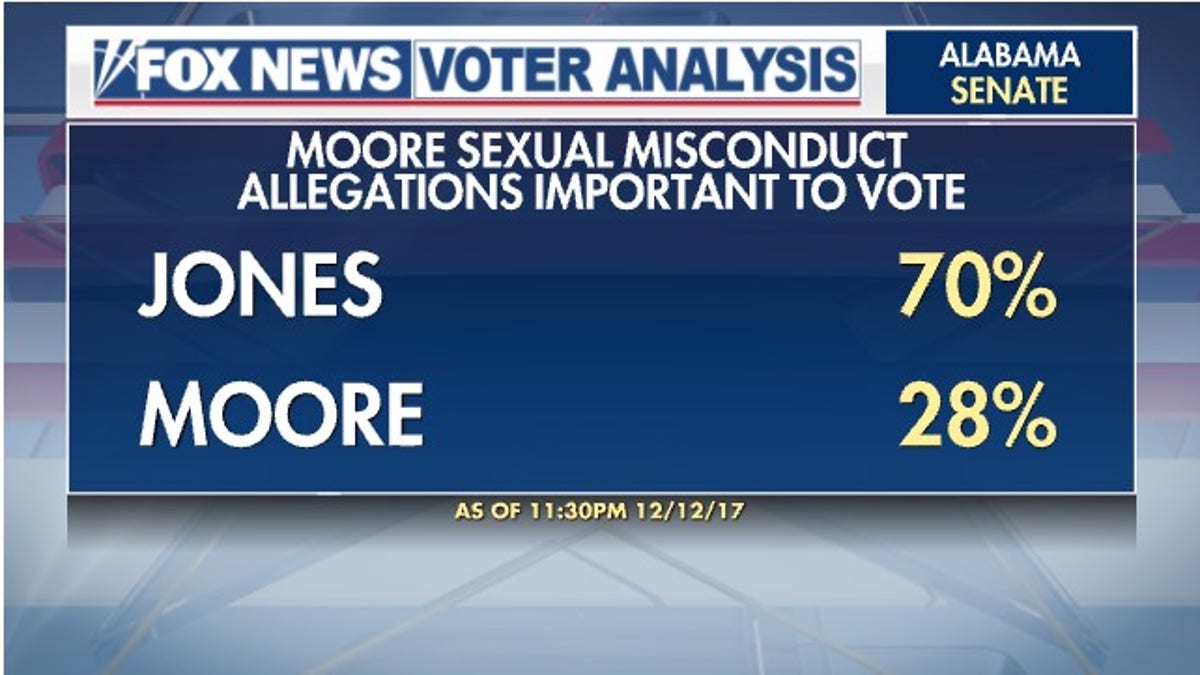
But in the end, by a narrow margin, Alabama voters believed the women – by a 49-44 spread. Nearly two-thirds (64 percent) said the allegations were important to their vote – and those voters went overwhelmingly for Jones.
The allegations also played a role in determining who turned out. Among nonvoters, nearly six-in-ten (57 percent) said the allegations were important to their decision not to vote, and non-voters believed them at a 58-percent clip.
National Republicans split in their response to Moore’s candidacy. President Trump, who won Alabama by 28 points in 2016, endorsed Moore on December 4 and held a rally just over the border in Pensacola, FL on December 8. For two-thirds of voters (66 percent), however, Trump was not a factor to their vote.
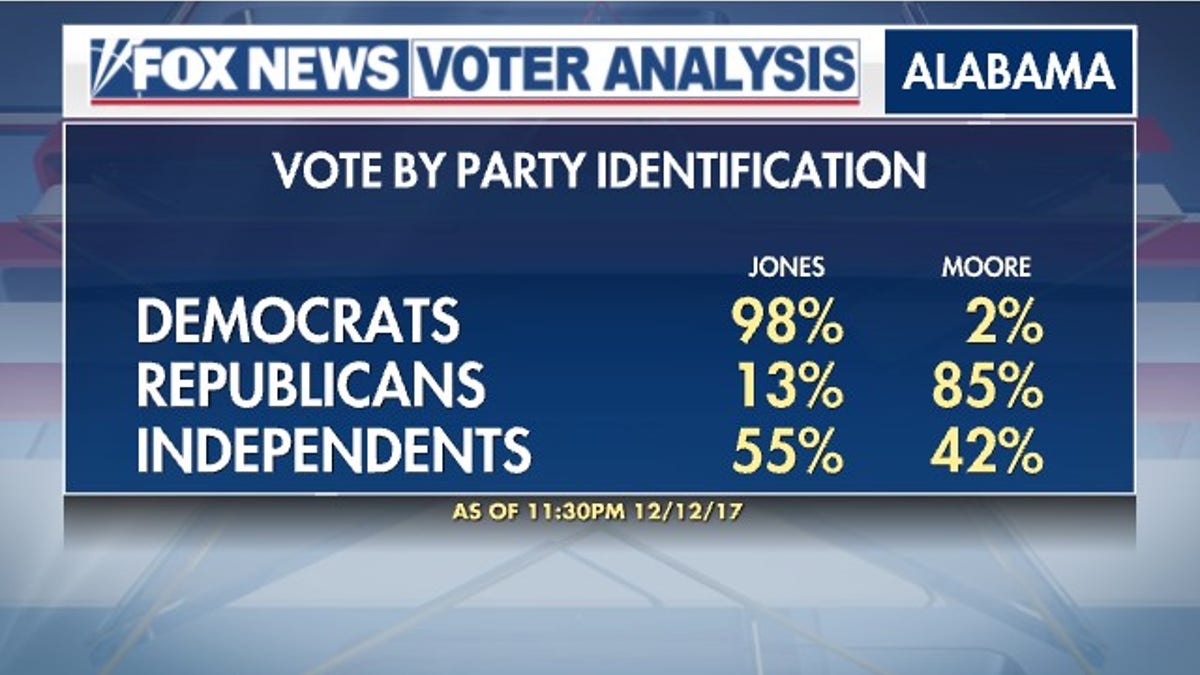
Alabama’s senior senator, Richard Shelby, announced on December 9 that he cast a write-in vote instead of voting for Moore. He wasn’t alone: 85 percent of Republicans voted for Moore, far fewer than the 98 percent of Democrats who went for Jones.

And in this traditionally deep-red state, independents went for the Democrat by a 55-42 margin.
More than nine-in-ten voters (91 percent) said the candidates’ personal morality was important to their vote. A similar number (88 percent) said which party controls Congress was important.
Jones won those who said personal morality was very important to their vote by 16 points, 57-41 percent. On the other hand, Moore won those who said partisan control was very important to their vote, 57-41 percent.
Eight-in-ten (79 percent) said abortion was important to their vote. Moore won those who said abortion was very important to their vote by 30 points. A majority of Alabamans (54 percent) believe abortion should be illegal – and they broke for Moore by an even wider 46-point margin, 72-26 percent.
Although policy issues mostly took a back seat on the campaign trail, voters were most concerned about the economy and health care, followed by race relations and immigration.
Health care voters (+28 points) and those who said race relations are the most important issue facing the country (+55 points) went for Jones by wide margins. Moore chalked up big wins among economy voters (+16 points) and immigration voters (+73 points).
Auburn may have won the most recent Iron Bowl, Alabama’s heart lies with the Tide. By a 47-19 point margin, more voters said they were fans of Alabama than Auburn. Jones scored a narrow 2-point win among Auburn fans, while Moore had a wider 6-point edge among ‘Bama fans. Jones won those who aren’t fans of either school, 60-39.
The Fox News Voter Analysis is based on a survey conducted by NORC at the University of Chicago with Alabama registered voters. The poll featured interviews from a probability sample drawn from a registered voter list and interviews from a non-probability sample, and includes both voters and non-voters for enhanced analytical purposes. The data collection was multi-mode (landline, cellphone, and online) and the full sample was calibrated to be representative of the population of registered voters as well as to be consistent with the actual election results. Results among all those interviewed in the probability sample have a margin of sampling error of plus or minus 4.1 percentage points including the design effect.


